Atlas x Pave Consumer Health Index: Paychecks Hold Steady as Household Financial Cushions Erode to Two-Year Low
Income held for a sixth straight quarter, but households now sit on their thinnest buffer in two years
Press Release Disclaimer: This is a press release distributed through the XPR Media network. It has not been independently verified by our newsroom.


American households are earning steadily but running on their thinnest cushion in two years, according to Q2 2026 findings from the Atlas x Pave Consumer Health Index released today. Built on behavior from more than 10 million accounts, incomes held firm for a sixth straight quarter even as gas prices and rising credit use thinned the buffer beneath them, hardest for the lowest cash-flow households.
This press release features multimedia. View the full release here: https://www.businesswire.com/news/home/20260722634809/en/
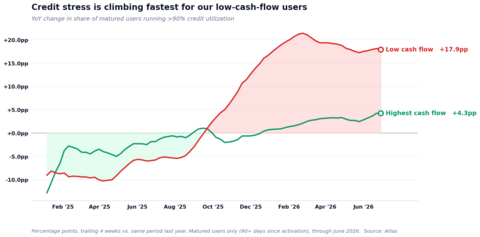
Credit is working harder at the bottom: the share of users above 90% utilization rose 17.9 points among lower cash-flow households over the past year, versus 4.3 points among higher. Source: Atlas x Pave Consumer Health Index, Q2 2026.
The Index functions as an early read on consumer health: it tracks real-time transactions across more than 10 million accounts, surfacing shifts in spending, income, and credit behavior weeks before they reach official statistics.
Inflation came back at the pump, and left the same way.
Gas rose to 16.1% of card spend in Q2, up 2.1 points from the prior quarter, as pump prices climbed roughly 59% between January and May; of every $1,000 a household put on its card, about $21 more went to gas than the quarter before. The rest of the essentials basket stayed calm, and national CPI confirmed the single channel both ways: it peaked at 4.2% in May, then reversed in June as gas fell, easing to 3.5% while core prices held near 3%.
Households adapted by trading down, not shutting down.
In groceries, Walmart lost 0.6 points of spend share year over year, the largest decline of any merchant in the data, while hard discounter ALDI posted the biggest gain. Entertainment rose 0.8 points: over half was TikTok (up 0.44 points), where users pay to boost their own posts, now a bigger slice of entertainment spend than PlayStation, Xbox, and movie theaters combined, with gambling and sportsbook merchants taking most of the rest. Travel and auto was the clearest discretionary cutback, down 0.5 points.
Income remained steady.
Payroll participation ran 6.4 points above its January 2025 baseline in April 2026 before softening to 5.0 points in May, the largest single-month drop in the series. Roughly 2.2% of users missed a paycheck each month, and nearly two-thirds were paid again within six months, churn the labor market is still absorbing. Nationally, unemployment held at 4.2% in June.
Consumer’s liquidity cushion kept thinning, unevenly.
Fewer households opened new credit, but the credit already in use is working harder: among lower cash-flow households, the share of users above 90% utilization rose 17.9 points over the year, versus 4.3 points among higher cash-flow households.
A new gambling signal is emerging.
Gambling appears in 6% to 10% of active users monthly, with the typical participant losing about $55, and the burden is regressive: the lowest income quartile spends about 4.5% of income on it versus 1.2% at the top. Gambling months were roughly 2.8 times more likely to include a cash advance, a marker of liquidity stress; recent peaks in activity have largely tracked big sporting events like the World Cup.
“The headline is that incomes are holding, but that’s not the whole story,” said Will Xu, Data Scientist at Atlas. “Households are earning steadily, but on a thinner and thinner cushion, and the strain isn’t evenly spread. The households with the least cash flow are leaning hardest on credit and taking the longest to pay it back. That’s the group we watch most closely, because they feel changes first.”
What We’re Watching
Two questions frame Q3: whether June’s energy reversal holds through the summer, and whether rising utilization at the bottom becomes payback stress.
Full report: atlasfin.com/consumer-index.
About the Atlas x Pave Consumer Health Index
The Atlas x Pave Consumer Health Index tracks U.S. household financial health across three dimensions: inflation pressure, income, and liquidity.
- Data source: Observed transaction data from Atlas and Pave, not survey responses.
- Population: More than 10 million accounts across Atlas credit card and Pave cash-flow infrastructure.
- Timeframe: Q2 2026 (April through June), measured against a two-year baseline.
- Cohort: Mainstream, fintech-adopting households, a leading-indicator population rather than a nationally representative panel.
ABOUT ATLAS
Atlas is a technology company building an accessible rewards credit card and automation platform. Its cash-flow-based underwriting approves more customers than traditional unsecured credit models, grows with them over time, and manages risk more effectively – expanding access to lower-cost capital. Atlas is building the Costco/Prime of financial services: the default platform where consumers start, build, and expand access to credit. Founded in 2022 and headquartered in San Francisco. Learn more at atlasfin.com.
ABOUT PAVE
Pave is the AI infrastructure for credit risk teams. Pave’s near-term risk scores combine cashflow, application, credit bureau, and loan performance data to predict near-term repayment outcomes. These scores power hundreds of millions of risk decisions each month across origination, payments, limit changes, and servicing. Pave’s AI agents extend that foundation, automating the full credit model lifecycle for lenders. Learn more at www.pavefi.com.
View source version on businesswire.com: https://www.businesswire.com/news/home/20260722634809/en/
Media gallery